I have recently moved/upgraded my Telegraf/ Grafana server into a FreeBSD Jail and decided to write this post in order to remind myself on how to setup a monitoring server.
The process described here has been performed on a FreeBSD 12.1-RELEASE server using the latest branches of the package manager and I am not sure if it can be applied to other OS.
The packages needed on the monitoring servers are the following:
pkg install influxdb grafanawhich at the time of my install it has installed influxdb-1.8.0 and grafana7-7.0.3. Then add the 2 service to /etc/rc.conf in order to start them at boot:
grafana_enable="YES"
influxd_enable="YES"
then:
service influxd start
service grafana start
At this point we should have the 2 processes running on the server’s network interface even using the default configuration:
#s sockstat -l4
SER     COMMAND    PID   FD PROTO  LOCAL ADDRESS         FOREIGN ADDRESS
grafana  grafana-se 20204 8  tcp4   172.16.100.31:3000    *:*
influxd  influxd    20117 6  tcp4   172.16.100.31:8088    *:*
influxd  influxd    20117 7  tcp4   172.16.100.31:8086    *:*
As you can see, InfluDB listens on 2 different TCP ports (8086 for the HTTP service where data can be sent by Telegraf and 8080 for RPC service) and Grafana listens on port tcp 3000 which is reachable by browser at http://serveripaddress:3000
The software that I am using to collect the data and send it to InfluxDB is Telegraf and can be installed on a FreeBSD server with:
pkg install telegrafwhich I have installed it on my FreeBSD firewall and with the latest branch it installed telegraf-1.14.4. Make sure to enable it in /etc/rc.conf in order to be good to go:
telegraf_enable="YES"Telegraf can collect metrics from a wide array of inputs and write them into a wide array of outputs. All the configuration is being set in /usr/local/etc/telegraf.conf and there are few inputs enabled by default. Here shown the few relevant for my firewall monitoring:
Then start the service with:
service telegraf startOnce started it will automatically create the “telegraf” database into InfluxDB upon sending the first successful byte of data. Now we can login into Grafana with “admin” as user and password and go into settings –> Data Sources. Here we can define a new source as Type: InfluxDB and as URL: http://localhost:8086, then press Save and Test. In order to create a graph it is necessary to create a new dashboard and then a panel, which it actually shows the data on screen. There are many examples/guides on internet but the relevant queries for me to get data from my firewall are:
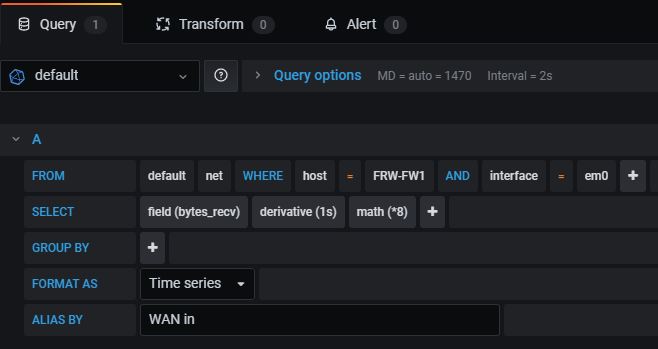
Traffic in bits/sec inbound on the WAN interface (the field query can be changed to gather the outbound traffic):
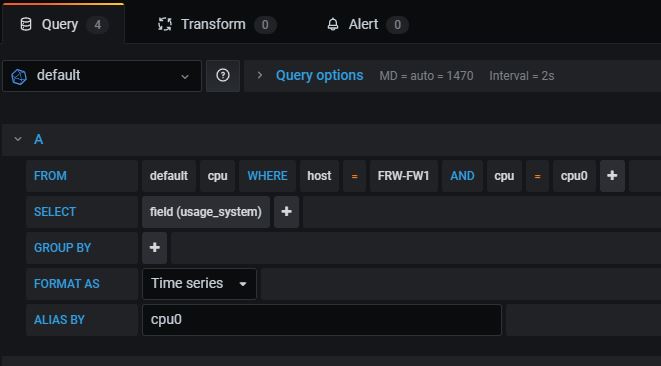
CPU usage (the field query can be changed to gather other CPU data as well if multi CPU):
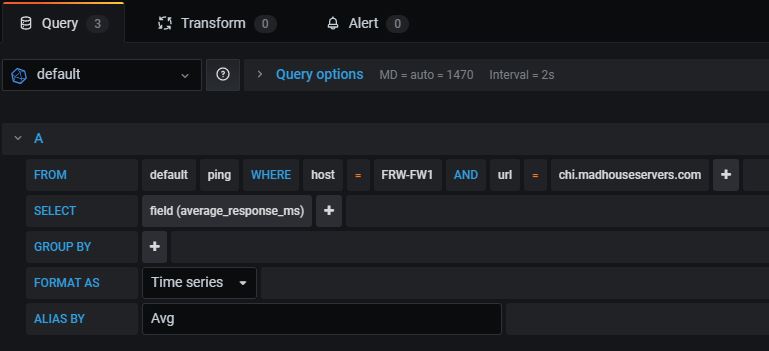
Latency of pinging the test server:
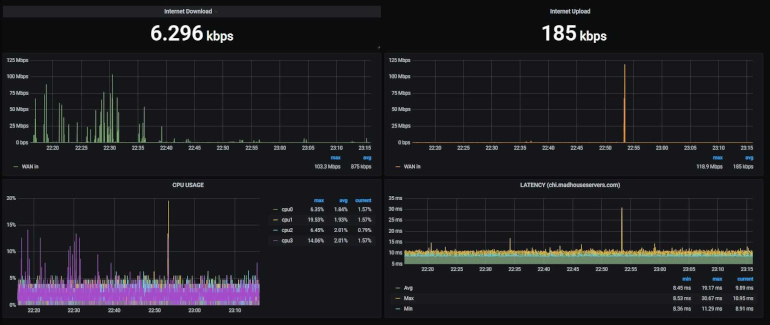
And here the final results with my dashboard: